双线性插值(Bilinear Interpolation)
前言
双线性插值是线性插值的扩展,它是用来在2D矩形网格中进行插值的函数,它需要输入x和y变量代表两个方向的坐标。
方法
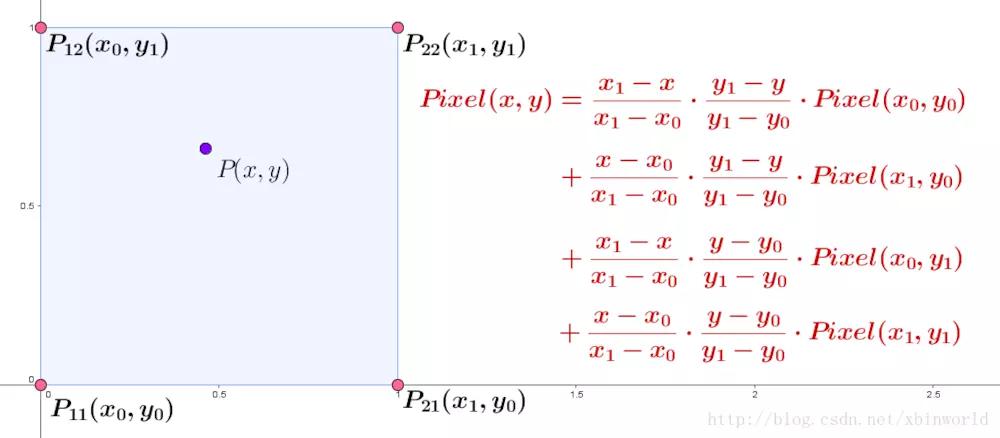
双线性插值的主要思想是先在一个方向进行线性插值,然后到达位置后再在另一个方向进行线性插值。尽管每个方向上都是线性插值,但是整体插值的计算是二次的。
做点有趣的事情
首先来做第一个实验,如果给出矩形4个点上的值,现在来计算矩形上一点的插值。
def bilinear_interpolation(x, y, points):
    """Interpolate (x,y) from values associated with four points.

    The four points are a list of four triplets:  (x, y, value).
    The four points can be in any order.  They should form a rectangle.

    >>> bilinear_interpolation(12, 5.5,
    ...                        [(10, 4, 100),
    ...                         (20, 4, 200),
    ...                         (10, 6, 150),
    ...                         (20, 6, 300)])
    165.0
    """
    # See formula at:  http://en.wikipedia.org/wiki/Bilinear_interpolation

    points = sorted(points)  # order points by x, then by y
    (x1, y1, q11), (_x1, y2, q12), (x2, _y1, q21), (_x2, _y2, q22) = points

    if x1 != _x1 or x2 != _x2 or y1 != _y1 or y2 != _y2:
        raise ValueError("points do not form a rectangle")
    if not x1 <= x <= x2 or not y1 <= y <= y2:
        raise ValueError("(x, y) not within the rectangle")

    return (
        q11 * (x2 - x) * (y2 - y)
        + q21 * (x - x1) * (y2 - y)
        + q12 * (x2 - x) * (y - y1)
        + q22 * (x - x1) * (y - y1)
    ) / ((x2 - x1) * (y2 - y1) + 0.0)


n = [
    (54.5, 17.041667, 31.993),
    (54.5, 17.083333, 31.911),
    (54.458333, 17.041667, 31.945),
    (54.458333, 17.083333, 31.866),
]

print(bilinear_interpolation(54.4786674627, 17.0470721369, n)) # 31.957986883136307
到这里一切顺利,那么双线性插值有什么作用呢?
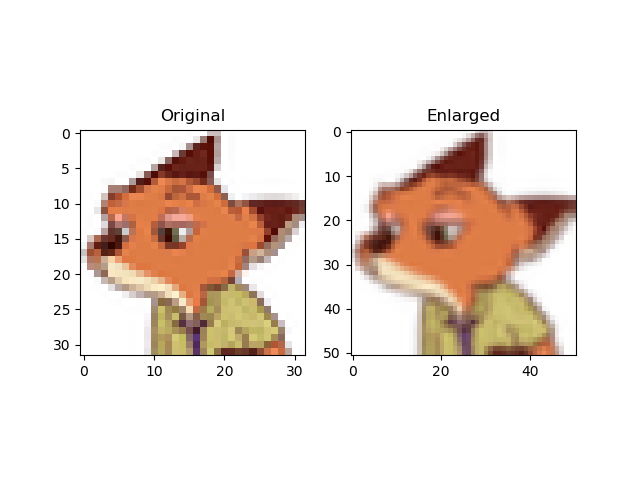
双线性插值可以用来对放大的图像进行插值,虽然使用PIL,scipy可以更快地做到,不过我们也可以实现自己的版本。
import io
import requests
import numpy as np
import matplotlib.pyplot as plt
from PIL import Image


def GetBilinearPixel(imArr, posX, posY):
    """Compute a interplated value in image imArr at position [posX, posY]
    """
    out = []

    # Get integer and fractional parts of numbers
    modXi = int(posX)
    modYi = int(posY)
    modXf = posX - modXi
    modYf = posY - modYi
    modXiPlusOneLim = min(modXi + 1, imArr.shape[1] - 1)
    modYiPlusOneLim = min(modYi + 1, imArr.shape[0] - 1)

    # Get pixels in four corners
    for chan in range(imArr.shape[2]):
        bl = imArr[modYi, modXi, chan]
        br = imArr[modYi, modXiPlusOneLim, chan]
        tl = imArr[modYiPlusOneLim, modXi, chan]
        tr = imArr[modYiPlusOneLim, modXiPlusOneLim, chan]

        # Calculate interpolation
        b = modXf * br + (1.0 - modXf) * bl
        t = modXf * tr + (1.0 - modXf) * tl
        pxf = modYf * t + (1.0 - modYf) * b
        out.append(int(pxf + 0.5))

    return out

# Read Image from Internet, here use the favicon of this website
r = requests.get("http://wangxin93.github.io/favicon.ico")
data = r.content
img = Image.open(io.BytesIO(data)).convert("RGB")
img = np.array(img)

# Compute the enlarged image size in int and scale
# rowScale, colScale are floats of range [0, 1]
ratio = 1.6
enlargedShape = (
    int(img.shape[0] * ratio),
    int(img.shape[1] * ratio),
    int(img.shape[2]),
)
enlargedImg = np.empty(enlargedShape, dtype=np.uint8)
rowScale = float(img.shape[0]) / float(enlargedShape[0])
colScale = float(img.shape[1]) / float(enlargedShape[1])

# Fill the enlarged matrix
for r in range(enlargedShape[0]):
    for c in range(enlargedShape[1]):
        orir = r * rowScale  # Fine position in original image
        oric = c * colScale
        enlargedImg[r, c] = GetBilinearPixel(img, oric, orir)

# Show original and enlarged images
plt.subplot(121)
plt.imshow(img)
plt.title("Original")
plt.subplot(122)
plt.imshow(enlargedImg)
plt.title("Enlarged")
plt.show()
顺利的话就可以看到下面的结果,对比两张图像和坐标轴可以发现:这里将本网站的favicon图标从(32,32)放大到了(51, 51)。
Congraulations!